【Go】pprofを使用したプロファイリングと可視化
Goの pprof を使うにあたり、調べた内容をメモしました。
Goプロファイリング手順
Goのプロファイリングは大きく以下の2工程に分けられます。
- 計測(pprofバイナリを作成)
- 出力(pprofバイナリを可視化)
1. 計測
Goバイナリを実行したときのCPU・メモリ等に対するプロファイリング結果を取得します。
◆ runtime/pprof で計測する
runtime/pprof パッケージをコード側で参照して計測します。
例えばCPUのプロファイル結果取得には runtime.StartCPUProfile が、(ヒープ)メモリのプロファイル結果取得には runtime.WriteHeapProfile が使用できます。
example
package main

import (
    "fmt"
    "os"
    "runtime"
    "runtime/pprof"
    "time"
)

func main() {
    fc, err := profileCPU()
    if err != nil {
        panic(err)
    }
    defer fc()

    fm, err := profileHeap()
    if err != nil {
        panic(err)
    }
    defer fm()

    process(10)
}

func profileCPU() (func(), error) {
    f, err := os.Create("cpu.pprof")
    if err != nil {
        return nil, err
    }

    if err := pprof.StartCPUProfile(f); err != nil {
        return nil, err
    }
    return func() {
        f.Close()
        pprof.StopCPUProfile()
    }, nil
}

func profileHeap() (func(), error) {
    f, err := os.Create("mem.pprof")
    if err != nil {
        return nil, err
    }

    runtime.GC() // reflect latest status
    if err := pprof.WriteHeapProfile(f); err != nil {
        return nil, err
    }
    return func() { f.Close() }, nil
}

func process(sec int) {
    for i := 0; i < sec; i++ {
        time.Sleep(time.Second)
        fmt.Printf("%ds...\n", i+1)
    }
    fmt.Println("finish.")
}
$ go run main.go
$ ls
cpu.pprof  main.go    mem.pprof
◆ net/http/pprof で計測する
_ net/http/pprof パッケージimportを宣言すると、HTTP requestをlistenするサーバーアプリケーションに対してプロファイリングをリクエストすることができます。
endpointは /debug/pprof/ です。
example
package main

import (
    "fmt"
    "log"
    "net/http"
    _ "net/http/pprof"
)

func handler(w http.ResponseWriter, r *http.Request) {
    fmt.Println("hello.")
    w.Write([]byte(`{"message":"hello"}`))
}

func main() {
    http.HandleFunc("/hello", handler)
    log.Println(http.ListenAndServe("localhost:6060", nil))
}
サーバーを立ち上げたあと、 go tools pprof を使用してendpointを指定すると、対象のサーバーのプロファイリングが開始されます。 seconds でプロファイリング時間を指定できます1。指定しなかった場合は30sです。
$ go run main.go

# heap - 10sプロファイリング
go tool pprof "http://localhost:6060/debug/pprof/heap?seconds=10"

# cpu
go tool pprof "http://localhost:6060/debug/pprof/profile"
go tool pprof でプロファイリング終了後はインタラクティブモードになり、その時点までのプロファイル結果を指定したコマンドで出力したりできます。
Fetching profile over HTTP from http://localhost:6060/debug/pprof/profile
Saved profile in /hoge/fuga/pprof/pprof.samples.cpu.003.pb.gz
Type: cpu
Time: Mar 21, 2022 at 3:35pm (JST)
Duration: 30.01s, Total samples = 0
No samples were found with the default sample value type.
Try "sample_index" command to analyze different sample values.
Entering interactive mode (type "help" for commands, "o" for options)
(pprof)
例えば web コマンドでブラウザでプロファイル結果を表示できます。
$ go tool pprof "http://localhost:6060/debug/pprof/profile?seconds=1"
...
(pprof) web

◆ go test -bench のオプションで計測する
xxx_test.go のようなテストプログラムでベンチマークを取る場合、 go test -bench 実行時にpprofバイナリを出力するオプションが使用できます。
cpuprofile
CPUプロファイル結果を出力します。
memprofile
メモリプロファイル結果を出力します。
blockprofile
同期プリミティブ(≒共有リソースへの複数アクセス)で発生したブロッキングを出力します。 www.tokumaru.org
mutexprofile
競合したミューテックスホルダを出力します。
example
$ go test -bench . -cpuprofile cpu.prof -memprofile mem.prof -blockprofile block.prof -mutexprofile mutex.prof
$ ls
bench_test.go  cpu.prof       mem.prof
block.prof     bench.test*     mutex.prof
出力されたバイナリ cpu.prof mem.prof を入力として、後続の出力に使用します。
2. 出力
net/http/pprof のインタラクティブモードのところで紹介してしまいましたが、出力した pprof バイナリは様々な形で可視化できます。
可視化には go tool pprof を使用できます。
go tool pprof -top
$go tool pprof -top mem.pprof
Type: inuse_space
Time: Mar 20, 2022 at 4:45pm (JST)
Showing nodes accounting for 3746.21kB, 100% of 3746.21kB total
      flat  flat%   sum%        cum   cum%
 1537.69kB 41.05% 41.05%  1537.69kB 41.05%  runtime.allocm
 1184.27kB 31.61% 72.66%  1184.27kB 31.61%  runtime/pprof.StartCPUProfile
  512.20kB 13.67% 86.33%   512.20kB 13.67%  runtime.malg
  512.05kB 13.67%   100%  1696.32kB 45.28%  runtime.main
         0     0%   100%  1184.27kB 31.61%  main.main
         0     0%   100%  1184.27kB 31.61%  main.profileCPU
         0     0%   100%   512.56kB 13.68%  runtime.mcall
         0     0%   100%  1025.12kB 27.36%  runtime.mstart
         0     0%   100%  1025.12kB 27.36%  runtime.mstart0
         0     0%   100%  1025.12kB 27.36%  runtime.mstart1
         0     0%   100%  1537.69kB 41.05%  runtime.newm
         0     0%   100%   512.20kB 13.67%  runtime.newproc.func1
         0     0%   100%   512.20kB 13.67%  runtime.newproc1
         0     0%   100%   512.56kB 13.68%  runtime.park_m
         0     0%   100%  1537.69kB 41.05%  runtime.resetspinning
         0     0%   100%  1537.69kB 41.05%  runtime.schedule
         0     0%   100%  1537.69kB 41.05%  runtime.startm
         0     0%   100%   512.20kB 13.67%  runtime.systemstack
         0     0%   100%  1537.69kB 41.05%  runtime.wakep
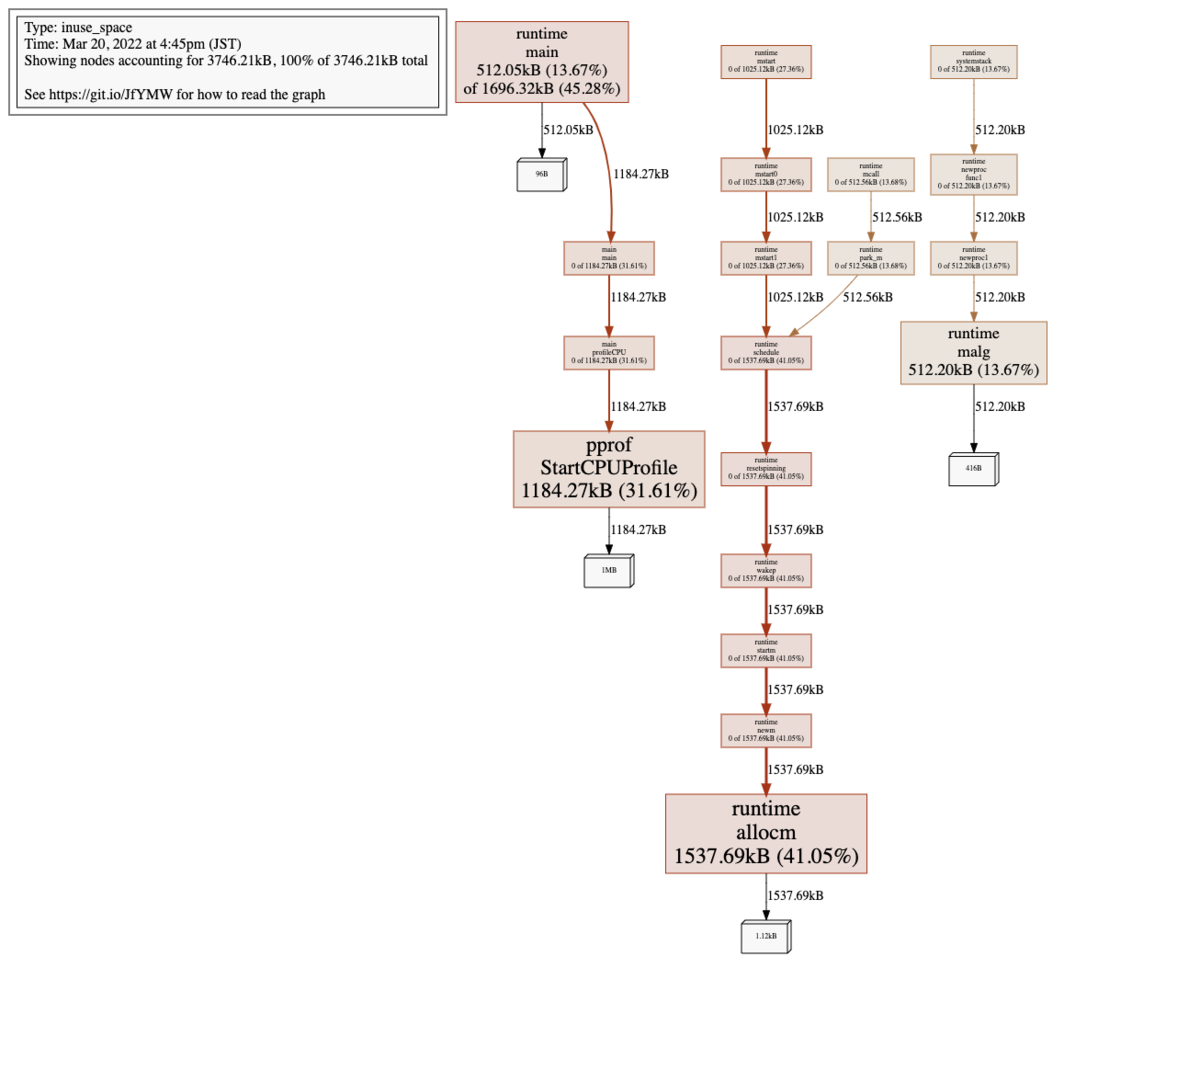
go tool pprof -web
net/http/pprof の項と同様、作成済みのpprofバイナリの結果をデフォルトWebブラウザ上で出力できます。
$ go tool pprof -web mem.pprof
またブラウザ上で http://{localhost}/debug/pprof/ を開くと、pprofの各プロファイル結果のページにアクセスすることができます。

インタラクティブモード
net/http/pprof ではendpointを指定していましたが、かわりに出力済みバイナリを指定することでもインタラクティブモードを開くことができます。
$ go tool pprof mem.pprof
Type: inuse_space
Time: Mar 20, 2022 at 4:45pm (JST)
Entering interactive mode (type "help" for commands, "o" for options)
(pprof)
その他のメモ
runtime/pprof はいくつかのOSにおいて正しい結果を出力できない様子。
$ go tools doc runtime/pprof
...
BUG: Profiles are only as good as the kernel support used to generate them.
See https://golang.org/issue/13841 for details about known problems.
例えばEl Capitan以前のOS Xだと以下のような誤ったスレッドに対しシグナルが送られるバグが報告されています。
OS X (fixed in OS X 10.11 El Capitan): Deliver signals to the wrong thread. On such systems, profiles are commonly very incorrect. See rsc.io/pprof_mac_fix for a workaround on those early systems.
プロファイリングする対象の環境ごとに予めチェックしてみると良いかもと思いました(仮想環境下だとまた変わったりするんだろうか)。